


You are looking at the documentation of a prior release. To read the documentation of the latest release, please
visit here.
New to Voyager? Please start here.
Monitor HAProxy using CoreOS Prometheus operator
This tutorial will show you how to monitor Voyager managed HAProxy pods using Prometheus via CoreOS Prometheus Operator.
Before You Begin
At first, you need to have a Kubernetes cluster, and the kubectl command-line tool must be configured to communicate with your cluster. If you do not already have a cluster, you can create one by using Minikube.
Now, deploy Voyager operator following instructions here.
To keep things isolated, this tutorial uses a separate namespace called demo throughout this tutorial. Run the following command to prepare your cluster for this tutorial:
$ kubectl create namespace demo
namespace "demo" created

$ kubectl get ns
NAME          STATUS    AGE
default       Active    45m
demo          Active    10s
kube-public   Active    45m
kube-system   Active    45m
Note that the yaml files that are used in this tutorial, stored in docs/examples folder in GitHub repository appscode/voyager.
Deploy CoreOS-Prometheus Operator
Now, run the following command to prepare your cluster for this tutorial:
$ kubectl create -f https://raw.githubusercontent.com/appscode/voyager/7.4.0/docs/examples/monitoring/coreos-operator/demo-0.yaml
clusterrole "prometheus-operator" created
serviceaccount "prometheus-operator" created
clusterrolebinding "prometheus-operator" created
deployment "prometheus-operator" created

$ kubectl get pods -n demo --watch
NAME                                   READY     STATUS    RESTARTS   AGE
prometheus-operator-79cb9dcd4b-2njgq   1/1       Running   0          2m


$ kubectl get crd
NAME                                    AGE
alertmanagers.monitoring.coreos.com     11m
prometheuses.monitoring.coreos.com      11m
servicemonitors.monitoring.coreos.com   11m
Once the Prometheus operator CRDs are registered, run the following command to create a Prometheus.
$ kubectl create -f https://raw.githubusercontent.com/appscode/voyager/7.4.0/docs/examples/monitoring/coreos-operator/demo-1.yaml
clusterrole "prometheus" created
serviceaccount "prometheus" created
clusterrolebinding "prometheus" created
prometheus "prometheus" created
service "prometheus" created
Prometheus Dashboard
Now to open prometheus dashboard on Browser:
$ kubectl get svc -n demo
NAME                  TYPE           CLUSTER-IP      EXTERNAL-IP   PORT(S)          AGE
prometheus            LoadBalancer   10.99.201.154   <pending>     9090:30900/TCP   5m
prometheus-operated   ClusterIP      None            <none>        9090/TCP         5m

$ minikube ip
192.168.99.100

$ minikube service prometheus -n demo --url
http://192.168.99.100:30900
Now, open your browser and go to the following URL: http://{minikube-ip}:{prometheus-svc-nodeport} to visit Prometheus Dashboard. According to the above example, this URL will be http://192.168.99.100:30900.
Create Ingress
We are going to use a nginx server as the backend. To deploy nginx server, run the following commands:
kubectl run nginx --image=nginx -n demo
kubectl expose deployment nginx --name=web --port=80 --target-port=80 -n demo
Now create Ingress ing.yaml
$ kubectl apply -f https://raw.githubusercontent.com/appscode/voyager/7.4.0/docs/examples/monitoring/coreos-operator/ing.yaml
ingress "stats-ing" created
apiVersion: voyager.appscode.com/v1beta1
kind: Ingress
metadata:
  name: stats-ing
  namespace: demo
  annotations:
    ingress.appscode.com/type: 'NodePort'
    ingress.appscode.com/stats: 'true'
    ingress.appscode.com/monitoring-agent: 'prometheus.io/coreos-operator'
    ingress.appscode.com/service-monitor-labels: '{"app": "voyager"}'
    ingress.appscode.com/service-monitor-namespace: 'demo'
spec:
  rules:
  - host: voyager.appscode.test
    http:
      paths:
      - path: /
        backend:
          serviceName: web
          servicePort: 80
Voyager operator watches for Ingress objects using Kubernetes api. When a Ingress object is created, Voyager operator will create a new HAProxy deployment and a NodePort Service with name voyager-{ingress-name}. Since ingress.appscode.com/stats annotation was configured, a stats service object is configured accordingly. Here,
| Keys | Value | Default | Description |
|---|---|---|---|
| ingress.appscode.com/stats | bool | false | Required. If set, HAProxy stats will be exposed |
| ingress.appscode.com/monitoring-agent | string | Required. Indicates the monitoring agent used. Here, we are using CoreOS Prometheus Operator. This agent was previously identified as coreos-prometheus-operator | |
| ingress.appscode.com/service-monitor-labels | map | Required. Indicates labels applied to service monitor. | |
| ingress.appscode.com/service-monitor-namespace | string | Required. Indicates namespace where service monitors are created. This must be the same namespace of the Prometheus instance. | |
| ingress.appscode.com/service-monitor-endpoint-port | integer | 56790 | Optional. Indicates the port used by exporter side-car to expose Prometheus metrics endpoint. If the default port 56790 is used to expose traffic, change it to an unused port. |
| ingress.appscode.com/service-monitor-endpoint-scrape-interval | string | Optional. Indicates the srace interval for HAProxy exporter endpoint |
You can verify it running the following commands:
$ kubectl get pods,svc -n demo
NAME                                      READY     STATUS    RESTARTS   AGE
po/nginx-8586cf59-rbc7x                   1/1       Running   0          5m
po/prometheus-operator-6c5f58dc5b-67wgb   1/1       Running   0          7m
po/prometheus-prometheus-0                2/2       Running   0          7m
po/voyager-stats-ing-5bf6b54949-kmc9w     2/2       Running   0          3m

NAME                          TYPE           CLUSTER-IP       EXTERNAL-IP   PORT(S)               AGE
svc/prometheus                LoadBalancer   10.111.248.128   <pending>     9090:30900/TCP        7m
svc/prometheus-operated       ClusterIP      None             <none>        9090/TCP              7m
svc/voyager-stats-ing         NodePort       10.105.130.139   <none>        80:31916/TCP          3m
svc/voyager-stats-ing-stats   ClusterIP      10.111.55.62     <none>        56789/TCP,56790/TCP   3m
svc/web                       ClusterIP      10.107.186.226   <none>        80/TCP                5m
$ kubectl get servicemonitor -n demo
NAME                     AGE
voyager-demo-stats-ing   4m

$ kubectl get servicemonitor -n demo voyager-demo-stats-ing -o yaml
apiVersion: monitoring.coreos.com/v1
kind: ServiceMonitor
metadata:
  clusterName: ""
  creationTimestamp: 2018-02-25T22:20:48Z
  labels:
    app: voyager
    monitoring.appscode.com/service: voyager-stats-ing-stats.demo
  name: voyager-demo-stats-ing
  namespace: demo
  resourceVersion: "1820"
  selfLink: /apis/monitoring.coreos.com/v1/namespaces/demo/servicemonitors/voyager-demo-stats-ing
  uid: 217225cb-1a7a-11e8-a133-080027640ad5
spec:
  endpoints:
  - path: /voyager.appscode.com/v1beta1/namespaces/demo/ingresses/stats-ing/metrics
    port: http
    targetPort: 0
  namespaceSelector:
    matchNames:
    - demo
  selector:
    matchLabels:
      feature: stats
      origin: voyager
      origin-api-group: voyager.appscode.com
      origin-name: stats-ing
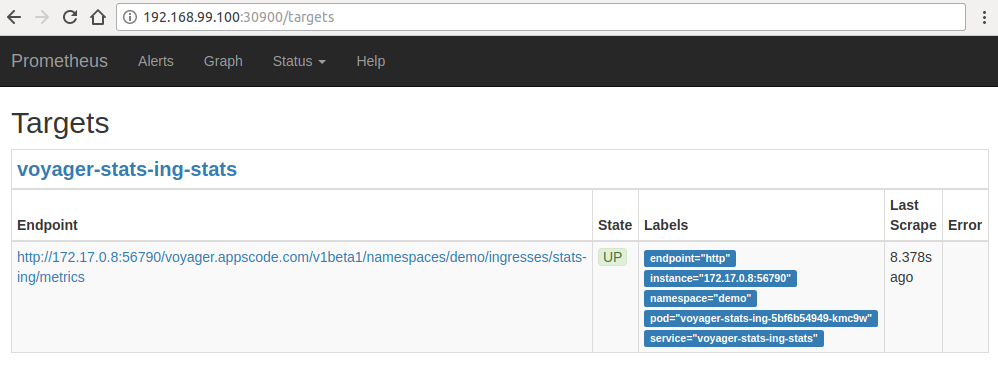
Now, if you go the Prometheus Dashboard, you should see that this database endpoint as one of the targets.
Known Limitations: If the database password is updated, exporter must be restarted to use the new credentials. This issue is tracked here.
Cleaning up
To cleanup the Kubernetes resources created by this tutorial, run:
$ kubectl delete ns demo
namespace "demo" deleted