


You are looking at the documentation of a prior release. To read the documentation of the latest release, please
visit here.
New to Voyager? Please start here.
Monitor HAProxy using Prometheus
This tutorial will show you how to monitor Voyager managed HAProxy pods using builtin Prometheus scraper.
Before You Begin
At first, you need to have a Kubernetes cluster, and the kubectl command-line tool must be configured to communicate with your cluster. If you do not already have a cluster, you can create one by using Minikube.
Now, deploy Voyager operator following instructions here.
To keep things isolated, this tutorial uses a separate namespace called demo throughout this tutorial. Run the following command to prepare your cluster for this tutorial:
$ kubectl create namespace demo
namespace "demo" created

$ kubectl get ns
NAME          STATUS    AGE
default       Active    45m
demo          Active    10s
kube-public   Active    45m
kube-system   Active    45m
Note that the yaml files that are used in this tutorial, stored in docs/examples folder in GitHub repository appscode/voyager.
Create Ingress
We are going to use a nginx server as the backend. To deploy nginx server, run the following commands:
kubectl run nginx --image=nginx -n demo
kubectl expose deployment nginx --name=web --port=80 --target-port=80 -n demo
Now create Ingress ing.yaml
$ kubectl apply -f https://raw.githubusercontent.com/appscode/voyager/7.4.0/docs/examples/monitoring/builtin-prometheus/ing.yaml
ingress "stats-ing" created
apiVersion: voyager.appscode.com/v1beta1
kind: Ingress
metadata:
  name: stats-ing
  namespace: demo
  annotations:
    ingress.appscode.com/type: 'NodePort'
    ingress.appscode.com/stats: 'true'
    ingress.appscode.com/monitoring-agent: 'prometheus.io/builtin'
spec:
  rules:
  - host: voyager.appscode.test
    http:
      paths:
      - path: /
        backend:
          serviceName: web
          servicePort: 80
Voyager operator watches for Ingress objects using Kubernetes api. When a Ingress object is created, Voyager operator will create a new HAProxy deployment and a NodePort Service with name voyager-{ingress-name}. Since ingress.appscode.com/stats annotation was configured, a stats service object is configured accordingly. Here,
| Keys | Value | Default | Description |
|---|---|---|---|
| ingress.appscode.com/stats | bool | "false" | Required. If set, HAProxy stats will be exposed |
| ingress.appscode.com/monitoring-agent | string | Required. Indicates the monitoring agent used. Here built-in scraper in Prometheus is used to monitor the HAProxy pods. Voyager operator will configure the stats service in a way that the Prometheus server will automatically find out the service endpoint and scrape metrics from exporter. |
You can verify it running the following commands:
$ kubectl get pods,svc -n demo
NAME                                    READY     STATUS    RESTARTS   AGE
po/nginx-8586cf59-r2m59                 1/1       Running   0          1m
po/voyager-stats-ing-5bf6b54949-5zs4x   2/2       Running   0          1m

NAME                          TYPE        CLUSTER-IP      EXTERNAL-IP   PORT(S)               AGE
svc/voyager-stats-ing         NodePort    10.111.51.103   <none>        80:31094/TCP          1m
svc/voyager-stats-ing-stats   ClusterIP   10.97.119.249   <none>        56789/TCP,56790/TCP   1m
svc/web                       ClusterIP   10.98.249.140   <none>        80/TCP                1m
$ kubectl get svc -n demo voyager-stats-ing-stats -o yaml

apiVersion: v1
kind: Service
metadata:
  annotations:
    ingress.appscode.com/origin-api-schema: voyager.appscode.com/v1beta1
    ingress.appscode.com/origin-name: stats-ing
    monitoring.appscode.com/agent: prometheus.io/builtin
    prometheus.io/path: /voyager.appscode.com/v1beta1/namespaces/demo/ingresses/stats-ing/metrics
    prometheus.io/port: "56790"
    prometheus.io/scrape: "true"
  creationTimestamp: 2018-02-25T21:48:24Z
  labels:
    feature: stats
    origin: voyager
    origin-api-group: voyager.appscode.com
    origin-name: stats-ing
  name: voyager-stats-ing-stats
  namespace: demo
  resourceVersion: "317"
  selfLink: /api/v1/namespaces/demo/services/voyager-stats-ing-stats
  uid: 9ac02c7c-1a75-11e8-a133-080027640ad5
spec:
  clusterIP: 10.97.119.249
  ports:
  - name: stats
    port: 56789
    protocol: TCP
    targetPort: stats
  - name: http
    port: 56790
    protocol: TCP
    targetPort: http
  selector:
    origin: voyager
    origin-api-group: voyager.appscode.com
    origin-name: stats-ing
  sessionAffinity: None
  type: ClusterIP
status:
  loadBalancer: {}
We can see that the service contains these specific annotations. The Prometheus server will discover the exporter using these specifications.
prometheus.io/path: ...
prometheus.io/port: ...
prometheus.io/scrape: ...
Deploy and configure Prometheus Server
The Prometheus server is needed to configure so that it can discover endpoints of services. If a Prometheus server is already running in cluster and if it is configured in a way that it can discover service endpoints, no extra configuration will be needed. If there is no existing Prometheus server running, rest of this tutorial will create a Prometheus server with appropriate configuration.
The configuration file to Prometheus-Server will be provided by ConfigMap. The below config map will be created:
apiVersion: v1
kind: ConfigMap
metadata:
  name: prometheus-server-conf
  labels:
    name: prometheus-server-conf
  namespace: demo
data:
  prometheus.yml: |-
    global:
      scrape_interval: 5s
      evaluation_interval: 5s
    scrape_configs:
    - job_name: 'kubernetes-service-endpoints'

      kubernetes_sd_configs:
      - role: endpoints

      relabel_configs:
      - source_labels: [__meta_kubernetes_service_annotation_prometheus_io_scrape]
        action: keep
        regex: true
      - source_labels: [__meta_kubernetes_service_annotation_prometheus_io_scheme]
        action: replace
        target_label: __scheme__
        regex: (https?)
      - source_labels: [__meta_kubernetes_service_annotation_prometheus_io_path]
        action: replace
        target_label: __metrics_path__
        regex: (.+)
      - source_labels: [__address__, __meta_kubernetes_service_annotation_prometheus_io_port]
        action: replace
        target_label: __address__
        regex: ([^:]+)(?::\d+)?;(\d+)
        replacement: $1:$2
      - action: labelmap
        regex: __meta_kubernetes_service_label_(.+)
      - source_labels: [__meta_kubernetes_namespace]
        action: replace
        target_label: kubernetes_namespace
      - source_labels: [__meta_kubernetes_service_name]
        action: replace
        target_label: kubernetes_name
$ kubectl create -f https://raw.githubusercontent.com/appscode/voyager/7.4.0/docs/examples/monitoring/builtin-prometheus/demo-1.yaml
configmap "prometheus-server-conf" created
Now, the below yaml is used to deploy Prometheus in kubernetes :
apiVersion: apps/v1
kind: Deployment
metadata:
  name: prometheus-server
  namespace: demo
spec:
  replicas: 1
  selector:
    matchLabels:
      app: prometheus-server
  template:
    metadata:
      labels:
        app: prometheus-server
    spec:
      containers:
        - name: prometheus
          image: prom/prometheus:v2.1.0
          args:
            - "--config.file=/etc/prometheus/prometheus.yml"
            - "--storage.tsdb.path=/prometheus/"
          ports:
            - containerPort: 9090
          volumeMounts:
            - name: prometheus-config-volume
              mountPath: /etc/prometheus/
            - name: prometheus-storage-volume
              mountPath: /prometheus/
      volumes:
        - name: prometheus-config-volume
          configMap:
            defaultMode: 420
            name: prometheus-server-conf
        - name: prometheus-storage-volume
          emptyDir: {}
Now, run the following command to deploy prometheus in kubernetes:
$ kubectl create -f https://raw.githubusercontent.com/appscode/voyager/7.4.0/docs/examples/monitoring/builtin-prometheus/demo-2.yaml
clusterrole "prometheus-server" created
serviceaccount "prometheus-server" created
clusterrolebinding "prometheus-server" created
deployment "prometheus-server" created
service "prometheus-service" created
Prometheus Dashboard
Now to open prometheus dashboard on Browser:
$ kubectl get svc -n demo
NAME                 TYPE           CLUSTER-IP       EXTERNAL-IP   PORT(S)               AGE
kubedb               ClusterIP      None             <none>        <none>                59m
mgo-mon-prometheus   ClusterIP      10.104.88.103    <none>        27017/TCP,56790/TCP   59m
prometheus-service   LoadBalancer   10.103.201.246   <pending>     9090:30901/TCP        8s


$ minikube ip
192.168.99.100

$ minikube service prometheus-service -n demo --url
http://192.168.99.100:30901
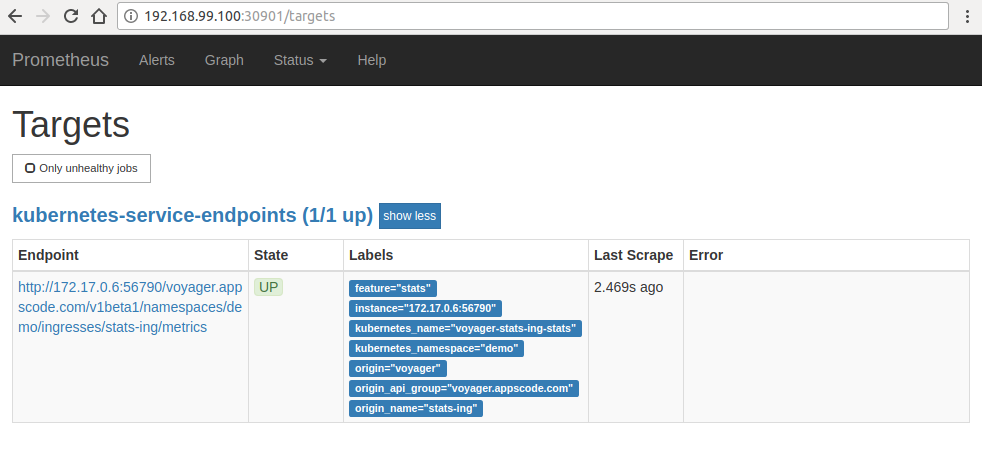
Now, open your browser and go to the following URL: http://{minikube-ip}:{prometheus-svc-nodeport} to visit Prometheus Dashboard. According to the above example, this URL will be http://192.168.99.100:30901.
Now, if you go the Prometheus Dashboard, you should see that the HAProxy pod as one of the targets.
Cleaning up
To cleanup the Kubernetes resources created by this tutorial, run:
$ kubectl delete ns demo
namespace "demo" deleted